IntelePeer Insights
Welcome to Insights, a metrics platform to help you identify trends across your customer interactions. Visit our Insights page to learn more.
Episode transcript
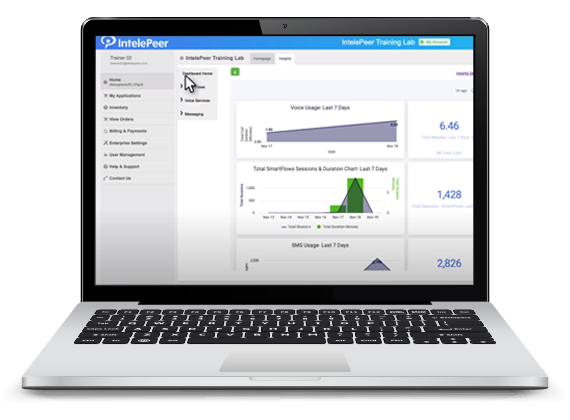
Welcome to Atmosphere Insights. Its metrics and charts help you view and identify trends across all your customer interactions from SmartFlows, voice services, and messaging. The results are visual dashboards with real-time visibility into your communications, call volume, location, performance, and historical trends. Let’s see how the power of Insights helps you quickly understand how Atmosphere drives your customer interactions. Welcome to Atmosphere Insights. Its metrics and charts help you view and identify trends across all your customer interactions from SmartFlows, voice services, and messaging. The results are visual dashboards with real-time visibility into your communications, call volume, location, performance, and historical trends. Let’s see how the power of Insights helps you quickly understand how Atmosphere drives your customer interactions. To get started, select a category and choose a dashboard to view. Filters let you manipulate the information visible on the page. Click the plus sign to add additional filter criteria and narrow the filter to your desired range of dates. You can see how current the data is, as well as refresh the data for the most up-to-date presentation. Insights widgets, the components of the dashboard, group data to help you make sense of your information. Some widgets display KPI’s, or key performance indicators, summarizing data into a single number. Other widgets present data in graphs and charts, providing different ways to view your data. You can isolate specific information in each graph by clicking the graph criteria on and off. Now that you can navigate in the Insights environment, let’s go deeper into the data. Elements in the widgets can provide you with detailed information about the data that drives the graphs. The number in a widget with a KPI is a clickable link. Clicking the link brings up a table with record level details, so you can understand how the totals are derived. You can download this table in a variety of formats to use with your favorite analytics tools. Set alerts based on thresholds you set and have them sent to your email address, so you can react quickly as issues occur. Dashboards can be scheduled to run on a recurring basis to keep track of your data and share it with external parties. Even without technical expertise, Insights gives you the power to visualize and customize your Atmosphere reports. Tame your business data and make it work for you with Atmosphere Insights.
